Using version 3570. I load 7 plugins and start them one by one. When I start izotope nectar 3, I start gettting glitches. I have used longer and longer buffer settings currently at 256. Time load over 100%. CPU load is about 20% and using about 4GB out of 8 GB total. Q9650 processor - Win7 SP1 64-bit. SSD disks.
The odd thing is that if I open Options and then just cancel it, the glitches stop and the time load goes down to 50%. No other problems.
Any ideas what is going on? I have saved profiles of both scenarios
The closest hing I can remember of a situation like this was located in this thread below where @brad and @humphrey (Volker) worked on a sticky plugin problem that caused uneven CPU usage, give it a look and see if it helps.
just saw the hinting of @dave_dore and thought I chime in. You can easily check out if this is familiar to my load balancing issue: when cpu overload occours simply turn off and on audio engine icon in the right top corner of the cantabile window.
If you get a similar drop in cpu load you can fix this issue by adding a binding like: „song - on load - restart engine“. Please keep in mind to count in about a second additional switching time from song to song which will be necessary to restart engine.
As I told Dave it’s a different situation in my case. I tried resetting audio with Shift+F1 and it doesn’t help. Only going into Options and out gets rid of the glitching.
Cantabile’s profiler in detailed mode is the best bet here. Last time I looked at a similar log, it showed increased CPU load across all tasks, not a specific plugin or audio engine process which suggests this is a CPU throttling type issue to me.
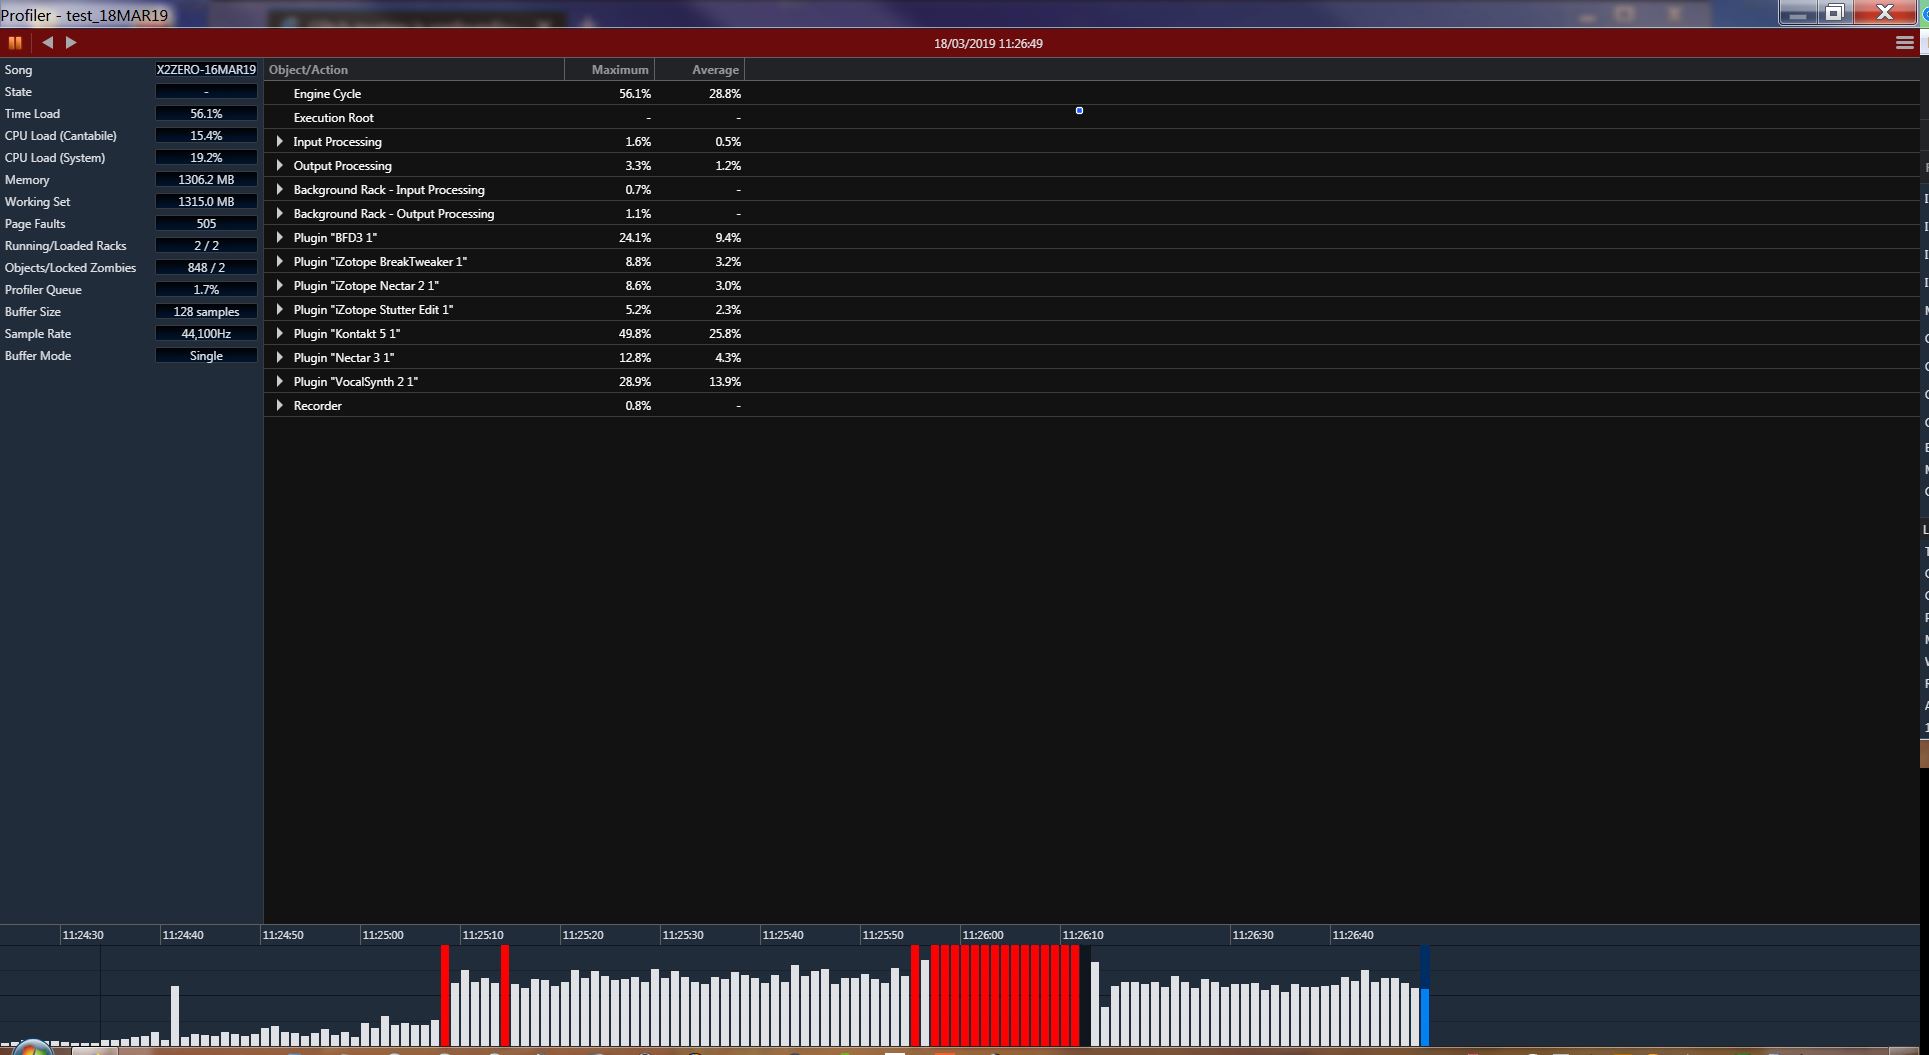
I attach detailed profiler report showing red where I started the Nectar 3 plugin reverting to white after engine stop/start. I had to rename the file type to ‘.Cantabile’ in order to upload. Please change back to ‘.CantabileProfile’ for analysis. I also attach jpg screenshot.
I’ve had a look at this. If you look at the time load metric in the left column in the red section and compare to the white section the number jumps from 60-70% to over 100%. The distribution of load across the plugins remains about the same which indicates this isn’t a single bottle neck but rather the CPU is just running slower.
I’d suggest try to replicate this with a CPU monitoring tool running to see if any of the cpu cores are being parked or throttled.
ThrottleStop, Bitsum Lasso and ParkControl are all configured to prevent CPU parking, speedstep and throttling, and optimize the PC for use with audio.
Engine stop then start routine always halves the Time Load reading and removes glitching.
At no time does CPU Load ever approach critical before or after engine ‘refresh’.
Best,
Nigel
PS: Soundcard is MOTU 828 Mk 3 Firewire using ASIO.
Not absolutely certain it is relevant, but I use a MOTU 828 mk3 hybrid on one machine in USB ASIO mode and a MOTU Ultralite mk3 hybrid in Firewire ASIO mode on the other without issues.
WAIT! Go into Device Manager and try disabling the MOTU Audio Wave for 64 bit device - on some setups that causes constant sample-rate sync problems. Worth a try. (If you were relying on that for Windows Audio, use Voicemeeter instead to interface Windows audio with your ASIO device if this turns out to be the culprit.)
No just checked it. The only difference is that ASIO4ALL uses 10% more CPU load.
This issue only arises when I turn on and off and edit plugins. If I then save that setup as a Song and then reload it, the Time Load settles back to the same value as if there had been an engine restart.
I have a basic starting point default Song with all the plugins loaded but not running. I then select plugins and edit them/load presets to suit. This is what causes the problem. Currently, only an engine stop/start gets things running smoothly again.
Hrm… not really sure what else to suggest. The only thing I can think is to try and narrow it down with some trial and error.
Some things to try:
Does disabling Cantabile multi-core support make a difference (ie: Options -> Audio Engine -> Number of Audio Threads -> 1 Disabled)
Try a different sound card/device. Even just the built in sound card on your motherboard would be an interesting experiment.
Does it happen with all plugins or only some?
I wonder if this is related to a poor implementation of the GUI of the affected plugins? Does the same or similar thing happen in other hosts after opening the plugin GUI?
When set to 1 Disabled, stopping and starting the engine has no effect. The Time Load stays the same. It doesn’t reduce.
All sound cards inc MB card WASAPI Out evince the same behaviour.
Not enough time to test every permutation, but yes stop/start engine always yields lower Time Load.
Using savihost for each plugin results in glitching when using only 3 plugins. Hard to compare. But yes opening the GUI in the izotope plugins in Cantabile does raise the Time Load figure. CPU load stays the same. Closing GUI reduces Time load again.
From which one might deduce that it may be down to the number of audio threads not responding to the increased load from starting/running more plugins. When the audio engine is refreshed the number of threads increases/responds to the load requirement. But I am no expert