As mentioned elsewhere, I’m currently working on a profiler to give some detailed insight into Cantabile’s audio engine performance. I thought I’d start a thread here to describe what it is, some technical details on how it works and progress updates.
In case you’re not sure what I mean by “profiler” then see here, but basically it’s a tool to give detailed break down of where time is being spent in the audio engine.
The main ideas are:
Provide a history of performance metrics (eg: load over the previous 5 minutes, with ability to go back and see what happened if something glitches)
Ability to get more fine grained detail on performance load - ie: per-plugin load times
Provide even more detailed views for diagnostic purposes - eg: break down of each step Cantabile performs
To also capture other performance metrics like page fault counts, cpu utilization, memory usage (again over time)
Ability to export profiler data (so you can send it to me for analysis)
Perhaps also include in the history load commentary events like “switch to song xyz”, “changed song state Verse 2”, etc…
The hardest part of all this is capturing all this information with adversely affecting performance - because that would defeat the purpose.
So far, I’ve built:
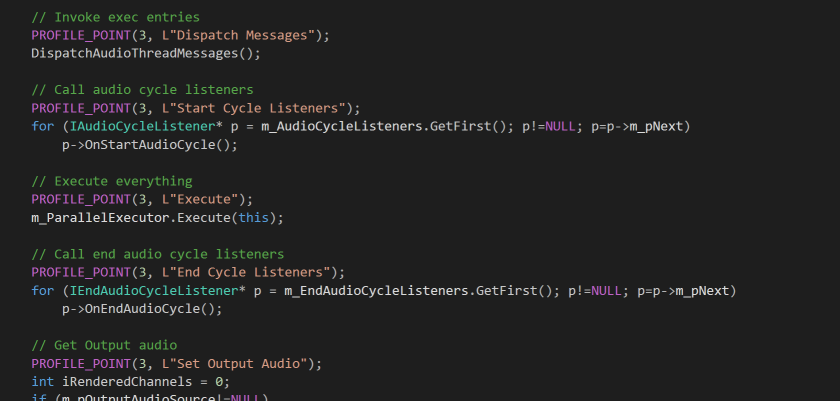
a framework into the audio engine that lets me mark certain parts of the code and the time taken to execute it will be captured into a stream of time stamped events.
an audio engine worker thread that collects all those events into a buffer and makes them available to the Cantabile front end
front end code that reads this event stream and builds a heirarchical breakdown of everything logged.
The calls to “PROFILE_POINT” are highly optimized inline functions that should have minimal impact on performance. Depending on the profiler level setting they might do nothing or, if profiling for that level is enabled they simply capture the time and write it to a per-thread lock-free ring buffer.
A worker thread then services the buffers, pulling the events into a larger buffer. This worker thread is above normal priority and runs about 1000 times per second. It’s main job is to keep the ring buffers from overflowing and to move the events to a larger resizeable buffer (since I can’t allocate memory on the audio threads - a big no no).
A second worker thread (in C# managed code) then reads events from the engine and coalesces them into 1 second intervals, where each interval records a tree of events that happened with timing statistics.
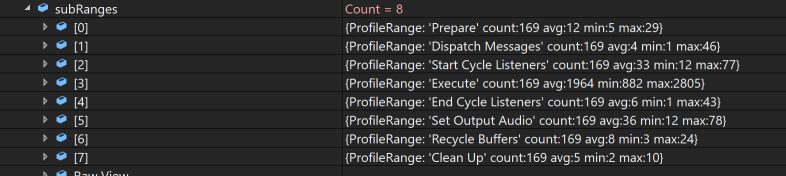
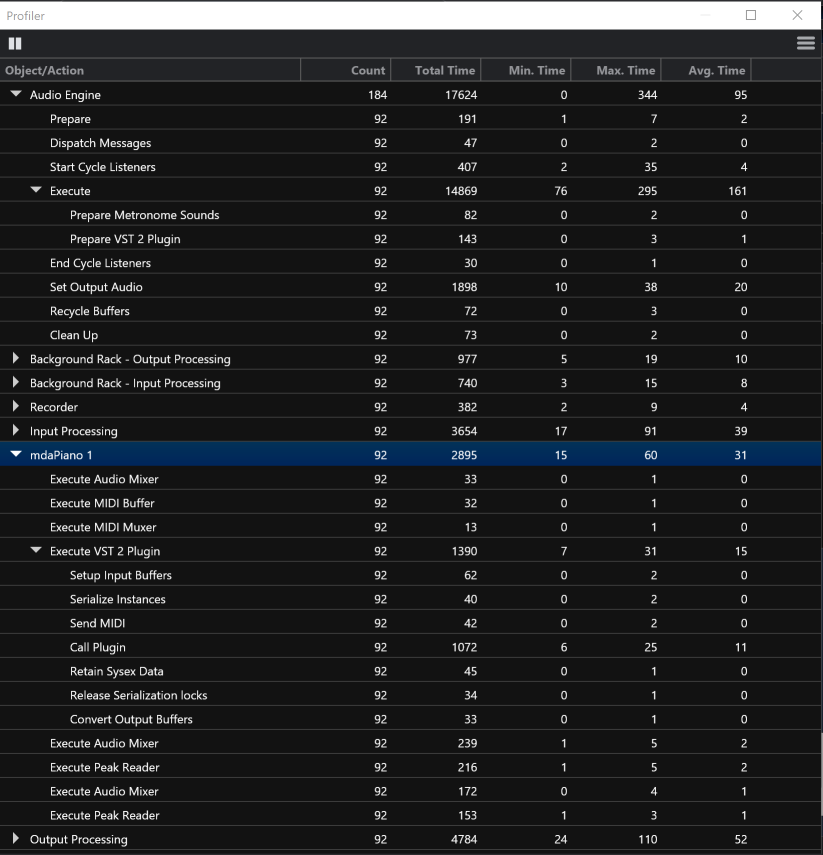
eg: here’s what the main audio cycle breakdown looks like (screen shot from Visual Studio debugger)
The basic framework seems to be working well. With 8 plugins loaded and the most detailed profiling enabled the audio engine is generating about 20,000 events per second with neglible impact on CPU load (maybe about 0.1% on my main development machine).
Sounds good, although, as you say, Heisenberg’s Uncertainty Principle is going to apply as when you measure things you will affect performance. But it sounds negligible so far. If my processor was that heavily loaded that an extra 0.1% sent it into glitching, then that is not a good place to be.
I think the extra overhead is worthwhile price to pay for better diagnostics. If the hit can be kept below 1%, I think that would be good.
Absolutely - I think if it is necessary, I could even live with a “diagnostics” version of Cantabile in parallel to the “live” version. One with the diagnostics code compiled into it and one without - for the last percentage points of performance.
Similar to a “debug” and a “release” version; debug contains a lot of debugging code that is simply not needed and wanted in a release version; so having a “diagnostic” version of Cantabile that gives me meaningful information on what I need to to to shave a few percent points off the load would be invaluable! But no need to run that same version in anger for live or rehearsal use…
The problem with that is that the extra code to turn it off could add even more overhead as you might then be doing lots of “IF DEBUG ENABLED THEN…” checks. The other issue with software is that trying to take things out can have inadvertent side effects, and I speak as somebody who has both developed and managed safety critical software projects.
The other issue is that if you had a performance issue during a gig and only then, then you would not have the performance logging.
So, IMO, it’s better to get it working with minimal overhead and prove that it works and leave it in.
That’s my two penneth worth, although Brad’s with his experience and knowledge of the Cantabile code base might have a different perspective
From what @brad has said this is already a part of the topology. When one of these logging events is called for a data point that is not enabled the code will return with no further action, which takes practically no time. If you must squeeze that last tiny bit of performance out of your system, simply disable all the tracking points.
Calculating per-plugin/instance memory usage is practically impossible - all it can really report is the total memory usage at a particular point in time.
As for performance impact of the profiler - this is something I’m very focused on. I too considered having a profiled and non-profiled version of CantabileCore.dll, but it’s an added dimension/complexity I’d like to avoid.
This is why those profile points are inlined - if they’re at a lower level than the current profiling level they don’t even make a function call, just a conditional jump which hopefully pipelining and branch-prediction should reduce to practically nothing. So far I haven’t noticed an impact on the load meter (even with profiling enabled) so I’m going with this approach for now. But… it would be easy to build a non-profiled core if necessary.
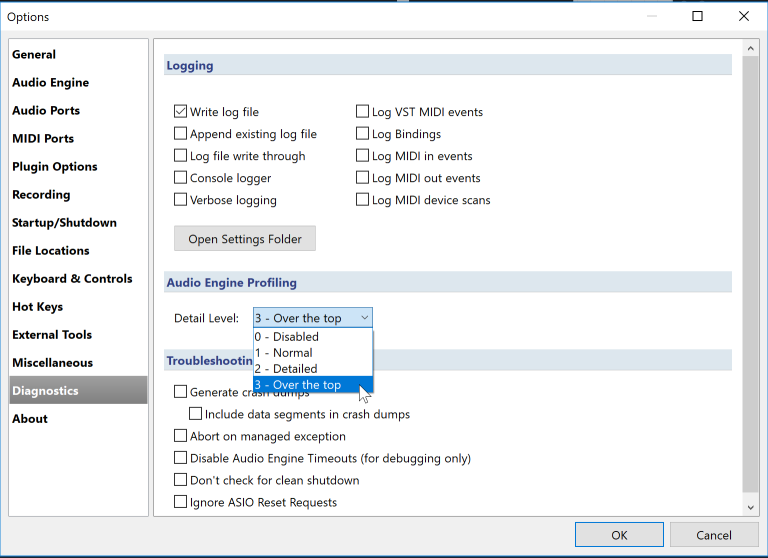
Once any profiling is enabled, the next most critical factor is how good the machine’s high-resolution performance counter implementation is. This will depend on the version of Windows and the hardware capabilities of the machine. The profiling code uses the Win32 function QueryPerformanceCounter - and inherits all it’s pros and cons. If querying the timer is slow, there’s not much I can do except to suggest leaving the profiling turned off. See this article. I don’t think this is an issue on most modern machines/OSes. Interestingly I noticed after testing QPC performance on a few different machines that Win10’s is slower than Win7’s (but still fast enough).
Another thing I’ve been thinking about is “non-realtime” profiling - a way to have the profile capturing enabled, but the analysis part disabled. The idea here is to just dump the raw profile data to disk. It could just be left running all the time (or perhaps just during rehersal) and when something goes wrong you could go back and post-analyse it. Not sure about this yet though.
All this is to say that it’s the capturing part that’s critical. It’s the bit that runs on the core audio threads and could impact audio, It’s the bit that I’ve optimized as much as possible including keeping everything non-locking, non-blocking, non-memory allocating etc… and seems to be working well. Everything else is less critical and should only burn spare CPU cycles that you’re not using anyway (if you’re cpu is running 100% you’ve got bigger problems).
Very nice, Brad! On the part about “Calculating per-plugin/instance memory usage is practically impossible”… could we toggle a “processing bypass” for an individual plug and capture the memory usage change? Knowing the load of individual plugins would be a godsend, and a lot faster than my current, unscientific method of watching the spikes on the load meter.
I agree with the others that anything under 1% hit is OK. Non-real time profiling would be OK too, I think, if it was instantly accessible so you could check it when a problem happens. For me, I’d probably only turn on profiling during testing of new songs/setups or personal practice sessions, and I’d turn it off for gigs. Unless the hit was really low, like .5%, and it was 100% stable, then it wouldn’t matter. But as a matter of habit I always turn off everything I don’t absolutely need, as a safety buffer.
Not really. Plugins can allocate/release memory as they run (eg: some samplers load a minimal sample set to start and then continue loading in the background) and bypassing a plugin doesn’t necessarily cause it to release everything (although unloading it would). Also, other things might allocate/free memory at the same time as the loading/unloading the plugin (eg; .NET memory allocations and garbage collector).
Yep, the profiler should give a good insight into this.
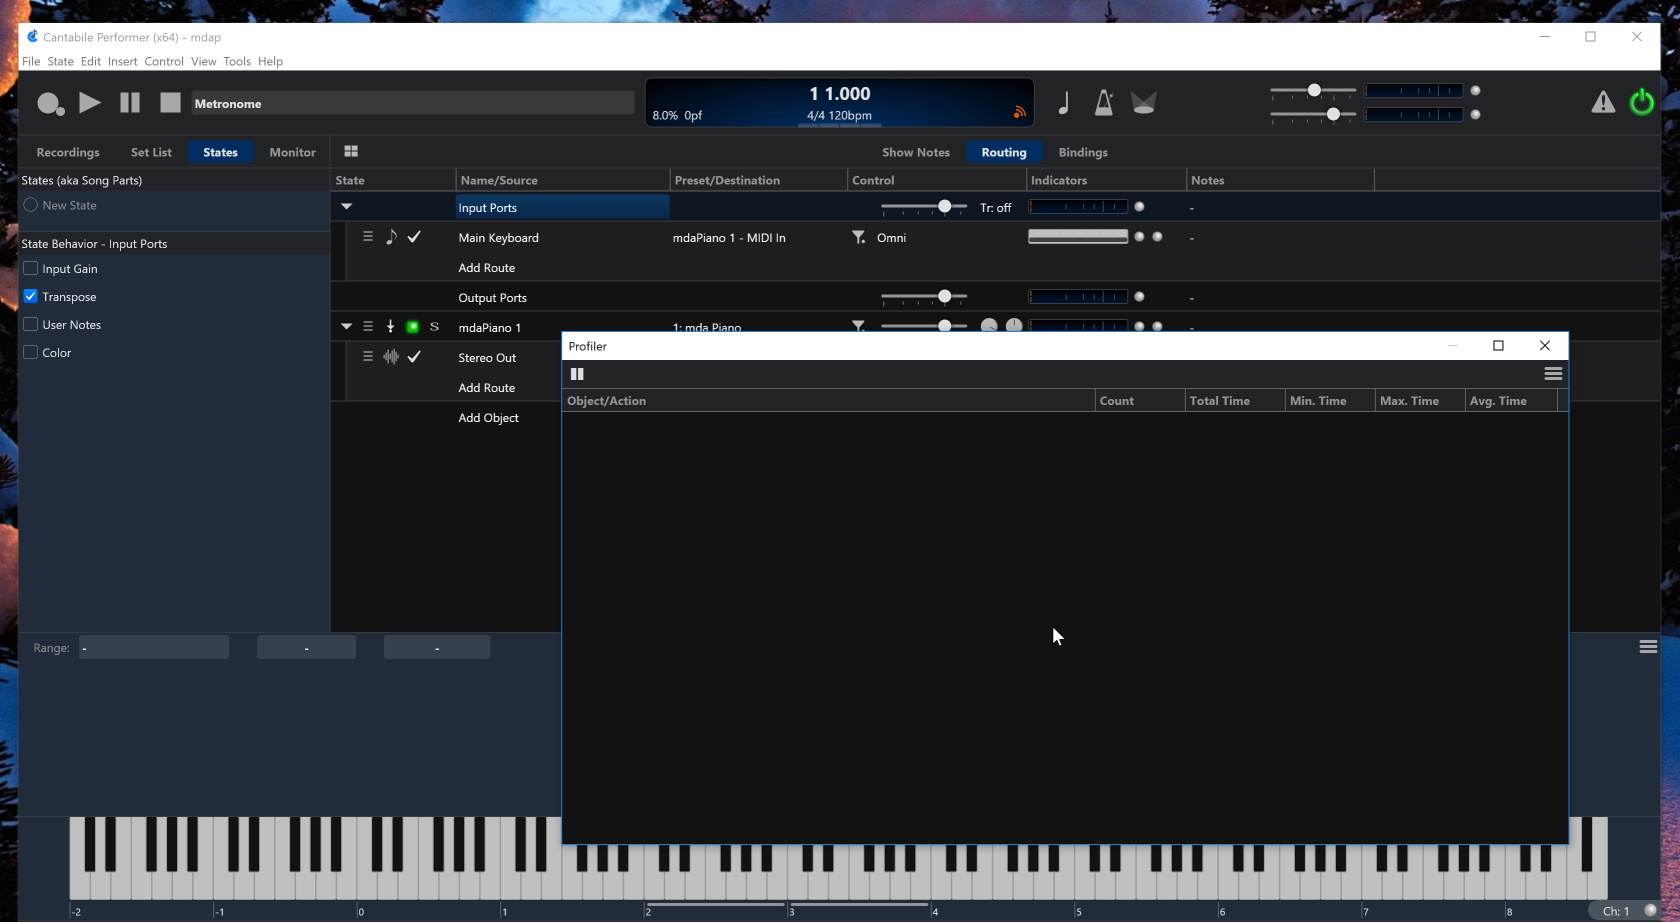
More work on the profiler… it now updates in realtime, has more meaningful sort order and fixed some bugs.
Note that racks and plugins in racks aren’t grouped as they’re configured in your song… rather each top level item in the profiler tree represents a “work item” - a single chunk of work that’s done by one core audio thread and I’ve just tried to group relative items together.