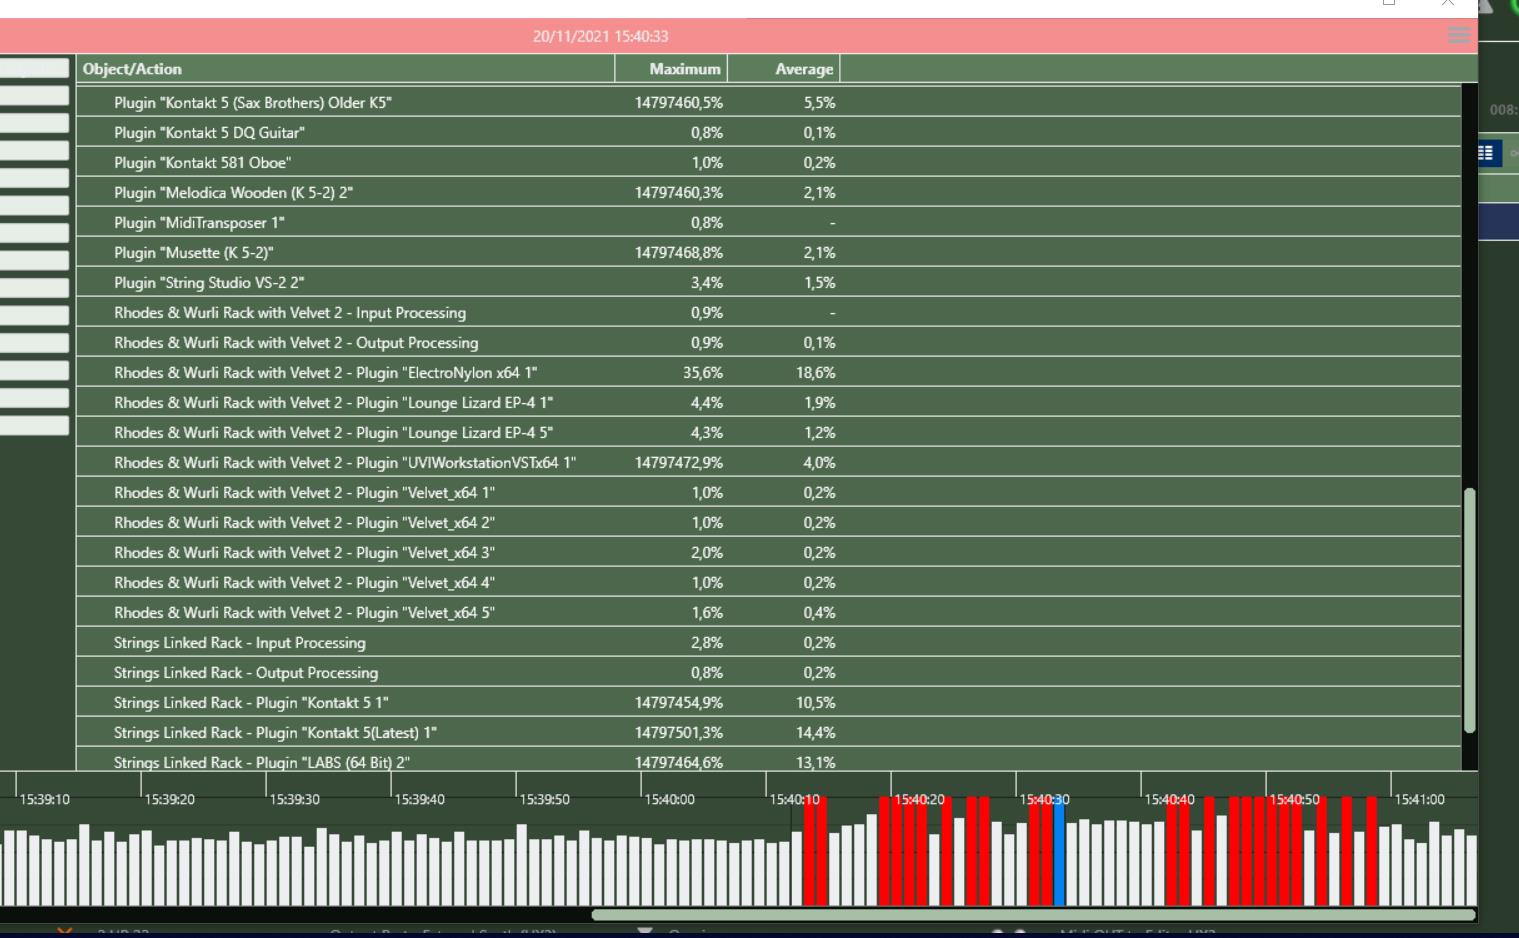
Horrible problems on last night’s gig - multiple notes started sticking at random moments. Sometimes I could clear them by a swift sweep of the keyboard but then they would start again at some other moment. In the middle of the set I had to do a restart (thank goodness we have another keyboard player!) but it happened once more after that. This has never happened before with my Cantabile setup since I started to use it live quite some years ago. I am now trying to recreate the issue at home though typically no luck so far. However, I opened the Profiler and see some rather bizarre - and very high - figures in the ‘maximum’ column, though no stuck notes yet. Anyone here have an explanation for these figures or seen this before? The problem sounded like a whole bunch of notes were being saved up then sent as one big dollop of midi!
I wish you could have tried this when it was screwing up but in case it helps Brad built in a monitor that determines if the stuck note is in the Controller. It would be good to know where the log jam is so if it happens check this while it’s hung top see.
Since the crazy percentages happen on your sample-based instruments (Kontakt, Labs) - could something be wrong with your hard disk? Or could some other process outside Cantabile be blocking the disk I/O?
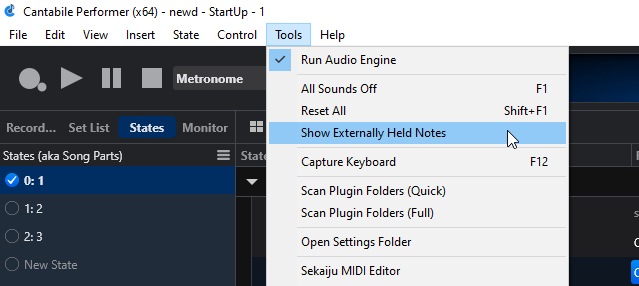
Thanks for these interesting ideas. Typically, after the three times it happened on Friday (it also did it during the sound check and I thought a restart had fixed it) it is not cooperating and doing it again so I can try and trace the issue. The hard drives are both Samsung Evo 970 SSDs - the plugins/samples are all on one and Windows/Cantabile on the other. The ‘Show Externally Held Notes’ will be useful - wish I’d known about that in the sound check! - if I can get it to do the craziness again.
Watching the Profiler while not playing I see that red indicators always show that ‘ElectroNylon’ reads a maximum of around 59%. I don’t even use this plugin now so that can go! Trouble is I’m reluctant to change anything before the issue happens again!
One other thought - the computer (a Skull Canyon NUC) does run quite hot. It’s inside the lower manual of my Hammond XK3 setup. It’s always been in there and I’ve never had any problems but one of the SSDs is relatively new and previously I only ran one SSD. Could this be related? Any thoughts?
Thanks for the ideas and I’ll report any success/findings back here. Next gig is Friday so I should have time to sort this
Make sure that the fan works and that it and the vents are clean and free of dust.
More than once I’ve seen CPUs throttlling down, due to insufficient cooling.
CPU load does seem too high. I’ve left the profiler running and the ‘red’ markers are pointing to two plugins in particular. Cantabile maximum reading does seem to be consistently above 75%, occasionally well over 100%, even an odd spike at 200%. Strangely, though, the midi madness problem has not been replicated yet. I’m going to start by deleting the offending plugins and see what readings I get. Cleaning the fan is a good suggestion - I just had to replace the fan in my other NUC and it was very dirty. The Cantabile NUC is an i7 with 32GB ram and although I’ve had no issues until now I’m maybe running too close to the plugin limits so I’ll get rid of anything that I don’t need for the gigs I’m doing right now.
I have noticed the same behaviour (huge values in the Maximum column) both for Iris2 and EightVoice in a song I am working on at the moment.
In my case, though, the average load is much smaller than 100% (no red bars in the lower portion of the profiler). If the percentage in the Maximum column is calculated as a ratio (as usual with percentages!) maybe, at times, the denominator of the ratio gets very small, virtually null…maybe @brad can shed some light on this.
Gabriele
Edit: Forgot to add that I am not experiencing any note sticking or other misbehaviour. So I suspect that the huge values are not correlated to the problems the OP is having.
I’ve got the red bars and high cpu percentages under control (I hope) by removing Spotlight Strings and ElectroNylon (by Sampleson) which were the main culprits. The latter is a bit odd since it is modelled as opposed to sampled. I’ve been running the system since the weekend but the mass stuck notes mayhem hasn’t reoccured. To be safe on this weekend’s gigs I have made a binding to the ‘all notes off’ command for my MixFace. Maybe it will never happen again!
Anyway, the issue made me do some obviously needed load control maintenance! Thanks for everyone’s help and comments.
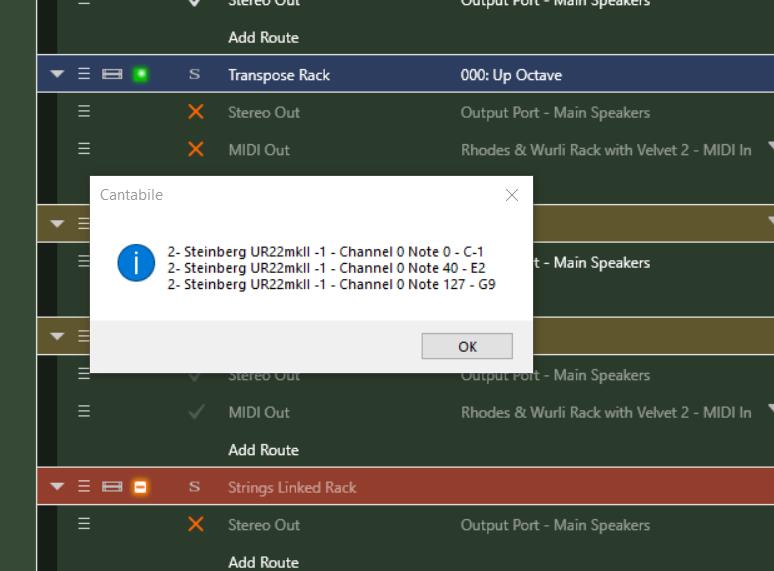
I played a few gigs without issue then in last Friday’s sound check the random midi stuck note thing happened again. This time I was able to use the ‘show externally held notes’ menu item (thanks dave_dore) and this is what it displayed:
I hit my new ‘all notes off’ binding and the problem didn’t occur again during that gig or the following one. Anyone know what this display actually means? What is Channel ‘0’? And I certainly can’t play a note G9 on my Hammond setup!
It’s a mystery I’d love to solve before it embarrases me mid-solo one evening