Gain Curve Request

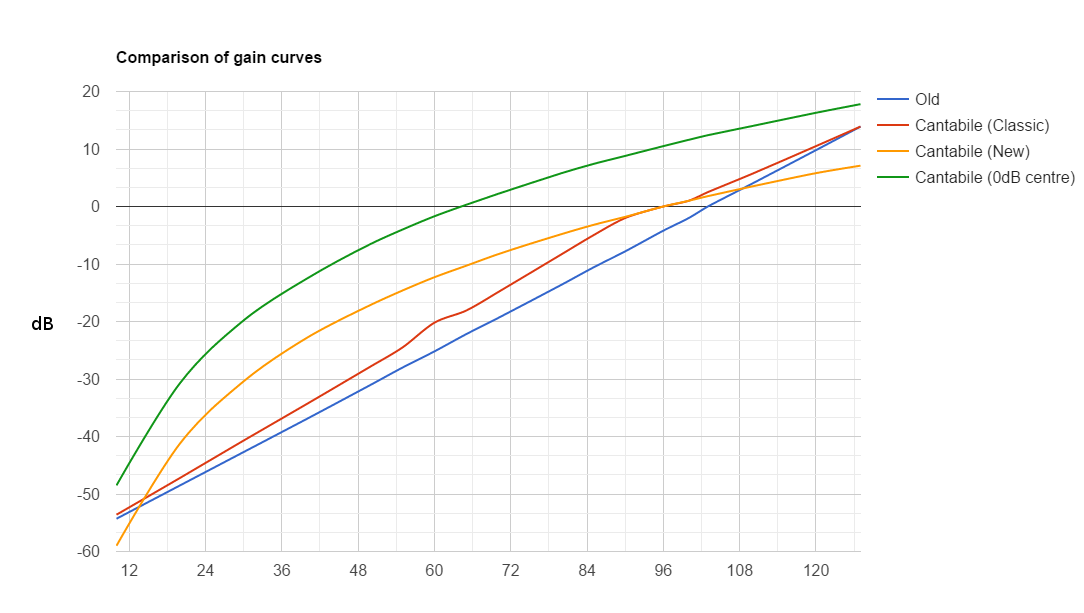
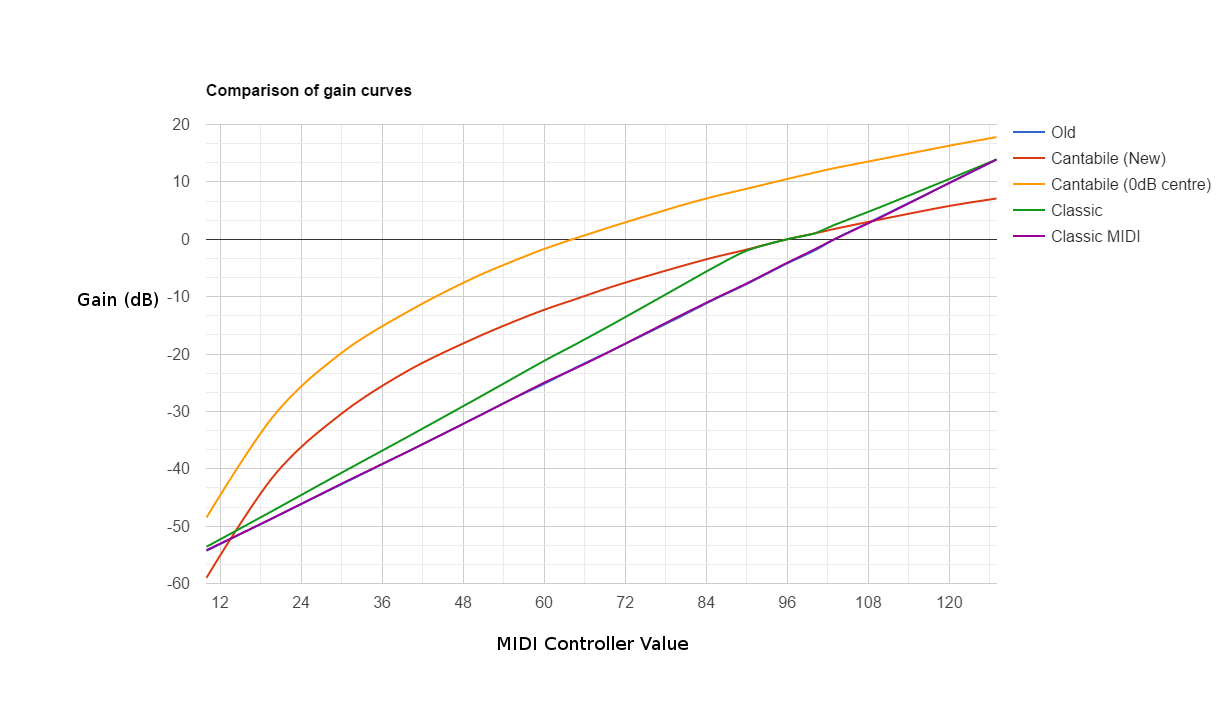
I’ve got a first pass of this working now and have come up with a control curve that I think works a lot better than the current slider.

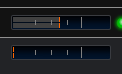
Here’s one version of it with 0dB at the center:

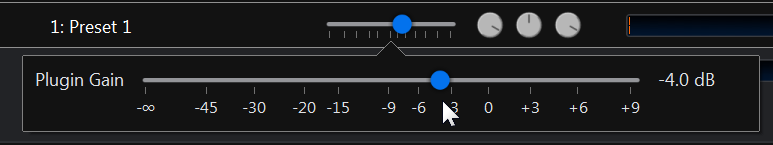
Here’s another with 0dB shifted right and not as much top end gain:

I’ve removed the snapping at the 0dB point. I’m not sure how to best handle this - snapping makes it hard to make fine adjustments around the snap points. The current build has a flat spot in the curve at the 0dB point but it makes the math really messy.

So I’m thinking about some other alternatives - perhaps a right click menu for things like 0dB, -oo and perhaps ability to switch into a fine adjust mode. Not sure yet.

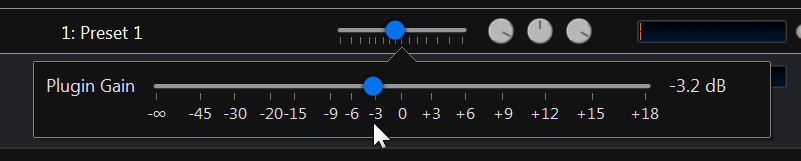
The slider implementation is done. I still need to figure out and update the level indicators and MIDI binding mapping.

Here’s an example control curve definition file: (feel free to give feedback on this)

{
	// Definitions are a set of function and/or constants

	"definitions":
	{
		// All control curves must provide these two functions 
		// (which must be the inverse of each other else weirdness will ensue).

		//  - Position ranges from 0.0 -> 1.0 and represents the slider position
		//  - Scalar is the amplitude scaling (ie: linear multiplier)

		"positionToScalar(x)": "pow(10, (log(x, 10) * slope - (log(zeroDbPos, 10) * slope)) / 20)",
		"scalarToPosition(x)": "pow(10, (log(x, 10) * 20 + (log(zeroDbPos, 10) * slope)) / slope)",

		// Higher value makes the slope of the curve steeper and gives a higher top gain level
		"slope" : 60,				

		// Position of the 0 dB mark
		"zeroDbPos": 0.5,			
	},

	"uiKinds":
	{
		"horizontalSlider":
		{
			"ticks":
			[
				{ "scalar": 0, "label": "-\u221E", },
				{ "scalar": "fromDb(-45)",	"label": "-45",	},
				{ "scalar": "fromDb(-30)",	"label": "-30",	},
				{ "scalar": "fromDb(-20)",	"label": "-20",	},
				{ "scalar": "fromDb(-15)",	"label": "-15",	},
				{ "scalar": "fromDb(-9)",	"label": "-9",	},
				{ "scalar": "fromDb(-6)",	"label": "-6",	},
				{ "scalar": "fromDb(-3)",	"label": "-3",	},
				{ "scalar": 1,	"label": "0",	},
				{ "scalar": "fromDb(3)",	"label": "+3",	},
				{ "scalar": "fromDb(6)",	"label": "+6",	},
				{ "scalar": "fromDb(9)",	"label": "+9",	},
				{ "scalar": "fromDb(12)",	"label": "+12",	},
				{ "scalar": "fromDb(15)",	"label": "+15",	},
				{ "scalar": "fromDb(18)",	"label": "+18",	},
			]
		}
	}
}
3 Likes

Looks great so far Brad! Presumably with the equations in the configuration file, we should be able to determine how to modify existing controller values that are bound to gain sliders, in order to achieve the same gain with the new sliders. Excellent!

It would be nice to have a separate ticks table for the small slider. I guess generally you’d want less markings on there, but at least having 0dB would be very valuable.

Neil

I’d suggest two things here:

  1. Modifier key, like ctrl, snaps to whole dB values
  2. Double-click the gain knob to send it to 0dB

Neil

3 Likes

Made a little more progress on this today with level meters now wired into this new controller curve functionality:

For these small horizontal level meters I couldn’t figure out a decent way to show the dB labels, so you just need to know where they are. By default from left to right they’re set to -30, -15, -6 and zero. Also note that if level meters and sliders are both set to the same controller curve then their positions match up exactly.

For level meters there will be some “special” tick kinds in the definition file:

	"levelMeter":
	{
		"ticks":
		[
			// These get displayed on the level meter as ticks
			{ "scalar": "fromDb(-30)",	"kind": "minor" },
			{ "scalar": "fromDb(-15)",	"kind": "minor" },
			{ "scalar": "fromDb(-6)",	"kind": "minor" },
			{ "scalar": 1,				"kind": "major" },

			// These describe how the transition to hot orange works
			{ "scalar": "fromDb(-6)",	"kind": "hotStart" },
			{ "scalar": "1",			"kind": "hotEnd" },

			// Hitting this point turns on the border clip indicator
			{ "scalar": "1",	"kind": "clipIndicator" },
		]
	}

Next is to update MIDI bindings to use a selectable curve. Probably just one global setting to start with.

1 Like

I liked whatever curve you used in version 2. Just saying.

I’d need to double check but I think it was almost the same as in v3 - although it’s changed a few times.

New build 3161 is up now with all this.

1 Like

Just posted a new article that explains the new settings and some tricks for working with sliders.

https://www.cantabilesoftware.com/blog/posts/78-new-gain-control-curves

1 Like

I find the meter on the monitor tab very useful. Shame I can’t have it visible all the time, eg under the master output gain on the control bar! :wink:

Thanks - yeah I’m going to be revisiting that whole topic soon as part of thinking about a mixing panel and new ways to arrange the main window for custom controls and layout.

Nice work on the new gain curves, Brad! I particularly like shift-drag for fine tuning gain sliders!

I decided to put together a graph comparing the gain curves when driven via a MIDI controller via a binding, with default full scale set. Primarily I did this to see how closely Cantabile (Classic) matches the curve from build 3160 and earlier, as I’m considering whether the difference is enough to worry about, because currently all my volume levels for all my sounds in all parts of all my songs come in via controller bindings to gain sliders. So I thought I’d post it in case it’s of any use to others.

Cantabile (Classic) maps to slightly higher gain in general than the older Cantabile, presumably in order to hit 0dB at 96 (older Cantabile hits 0dB at around 103). Also interestingly there appears to be a slight hump around -20dB (controller value 60) in Cantabile (Classic). You can also see the slight flat spot around 0dB mentioned in the blog post for 0dB snapping (interesting that this also applies for MIDI bindings, not just user-interface interactions).

Incidentally, if the meters are set to Cantabile (Classic), no ticks are shown - is this intentional?

Neil

2 Likes

Off-Topic: Neil, great Matlab plots! :grin:

1 Like

Hey Neil,

Nice graph! The bump at 60 is a bit weird - not sure where that’s coming from I’ll need to check that out. The difference between the old curve and the classic curve is that the old midi bindings didn’t use a curve at all - as you can see it was a linear mapping onto a dB scale. The classic curve is meant to simulate the old slider behavior (with the flat spot around 0dB). Perhaps I should knock together a “Classic MIDI” curve.

Level meter ticks on classic are probably just an oversight (they’re declared in the control curve file and I probably forgot to update it).

Brad

Hey @Neil_Durant - that graph is cropped a little on the left right? The Old MIDI curve should have started just about -60dB.

I’ve implemented a new control curve “Cantabile (Classic MIDI)” which I think matches the old curve a lot better. Available in build 3162 available now and also includes a fix for the missing level meter ticks.

It started at cc value 10, mainly because my screen wasn’t big enough for a linear graph that went down to negative infinity :slight_smile:

Mine is… just sayin’…

Terry

2 Likes

I’ve just updated the guides to include details on writing custom control curves and a reference for the expression evalution engine.

Also, I’m curious - are you finding the new curves better, worse, about the same?

2 Likes

Hey Brad, I’m definitely finding the new curves better, particularly Cantabile (new). Just more control in the upper area of the curve, where gain sliders tend to mostly be. Controlling gain via a foot expression pedal feels more natural and easier too with the new curves.

I’ve updated my gain curve graph with the new curves (using build 3166), and Cantabile (Classic MIDI) is now virtually identical to the original Cantabile curve (before the new curves), with under 0.1dB difference at all the points I checked. It’s just about indistinguishable on the graph. This is excellent - it means I can transfer all my gain information into Cantabile from my controller keyboard, save the gains in song states, and then switch to the new curves :smile:

Incidentally, I wonder now if that kink in my original graph was just a typo on my part, when entering stuff into my spreadsheet…

Neil

2 Likes

Thanks for the updated graph and glad the new curve is working better.

Re: the kink - I did check the math and couldn’t explain it but never chased it down - perhaps it was a typo.

1 Like